In Australia, the RBA left the official cash rate on hold at 2% on 2 December 2015. The US Federal Open Market Committee (FOMC) met on 26 to 27 January 2016 and decided to leave the official Fed Funds target rate at 0.25% to 0.50% as was widely expected. The European Central Bank (ECB) met on 21 January 2016 with no changes to monetary policy announced. The Bank of England (BoE) left policy unchanged when it announced its decision on 14 January 2016, as expected. The Bank of Japan's (BoJ) policy board convened on 29 January 2016 and added a new dimension to their policy armoury by lowering by 20bps one of its new three-tiered policy rates to -0.1%.
Australia
The Reserve Bank of Australia (RBA) left the official cash rate on hold at 2% on 2 February 2016 - where it has remained since May 2015. The next RBA Board meeting is 1 March 2016.
The statement highlighted the tensions between improving trends in the domestic economy and mounting external shocks “over the period ahead, new information should allow the Board to judge whether the recent improvement in labour market conditions is continuing and whether the recent financial turbulence portends weaker global and domestic demand” while leaving the door open for futures rate cuts if deemed appropriate “continued low inflation may provide scope for easier policy, should that be appropriate to lend support to demand”.
Labour market data continued to surprise on the positive side, although there are some data quality issues. The official seasonally-adjusted rates in recent months, and the housing sector has improved further; however, net exports have been soft and inventory investment slowed”.
The next meeting will be held on 17 to 18 March 2016.
The first estimate of Q4 2015 GDP was released indicating growth was 0.7% on a seasonally-adjusted-annualised-rate, below expectations and lower than the 2% recorded in Q3 2015. Personal spending rose 2.2%, while net exports and inventories each subtracted 0.5% from GDP. Overall for 2015, the US economy grew by 2.4% for the second straight year.
Europe
The European Central Bank (ECB) met on 21 January 2016 with no changes to monetary policy announced. The ECB last made changes in December 2015 when the interest rate on the deposit facility was cut by 10 basis points to -0.30% and the asset purchase program (APP) was extended until the end of March 2017 with the ECB noting at the January meeting that the “decisions were fully appropriate. They will result in a significant addition of liquidity to the banking system and will strengthen our forward guidance on interest rates”.
The estimate for CPI inflation in January was 0.4% per year for headline and 1.0% per year for core inflation, both up marginally from December.
UK
The Bank of England (BoE) left policy unchanged when it announced its decision on 14 January 2016, as expected. The Bank Rate was unchanged at 0.5% and the stock of asset purchases remained at £375bn. There was one dissent on the nine member board, the sixth meeting in a row.
The advance estimate for Q4 2014 GDP was 0.5% per quarter and 1.9% per year, down from 2.1% per year with growth driven all by the services sector.
Japan
The Bank of Japan's (BoJ) policy board convened on 29 January 2016 and added a new dimension to their policy armoury by lowering by 20bps one of its new three-tiered policy rates to -0.1%. The BoJ has labelled the policy action “Quantitative and Qualitative Monetary Easing (QQE) with a Negative Interest Rate.”
$US2.31/MMBtu and the UK natural gas price down 13.9% over January.
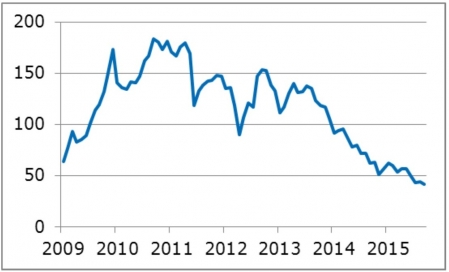
Iron ore prices were weaker in January, down 4.2% to $41.7/metric tonne, as measured by the benchmark price of iron ore delivered to Qingdao China – 62% Ferrous Content.
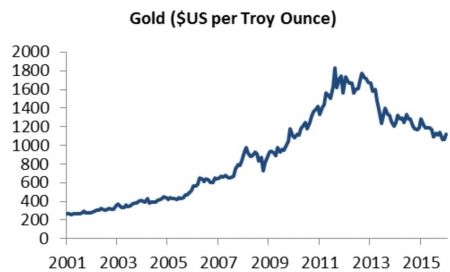
Copper (-3.1%), lead (-4.2%) and nickel (-2.3%) fell in January, while Gold (+5.2%), Aluminium (+0.8%) and Zinc (+0.9%) made gains.
IRON ORE DOWN SLIGHTLY

Source: Bloomberg as at 31 January 2016
GOLD STRONGER IN JANUARY

Source: Bloomberg as at 31 January 2016
Australian equities
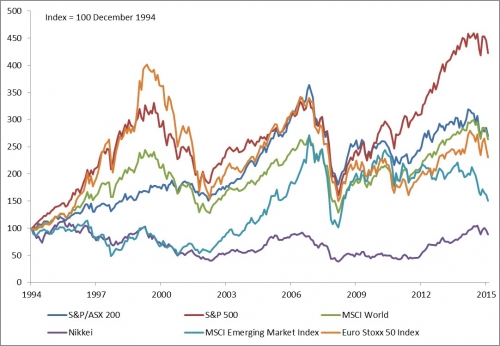
It was a disappointing start to the new year for Australian equities, with the S&P/ASX 200 Accumulation Index closing January 5.5% lower.
The Index was led lower by stocks in the Financials sector. ANZ Banking Group declined in value by 13.4%, for example, while the other three ‘big banks’ all closed the month around 8% lower.
Most materials stocks announced quarterly updates too. BHP Billiton (-14.1%) announced it
reasons for equity market falls were exacerbated by ongoing volatility, indiscriminate selling, sharp falls in the oil price and further Renminbi weakness due to a lack of policy coordination and communication in China.
On 19 January 2016 the IMF downgraded its assessment of global growth to 3.4% from 3.6% in 2016 and in 2017 to 3.6% from 3.8%.
With large volatility in equity markets and signs of downside risks to global growth, there was renewed speculation over central bank policy announcements with further easing measures expected. On the last trading day of the month the Bank of Japan surprised markets by introducing negative rates to its already aggressive expansion in monetary base.
The MSCI World Index fell by 6.1% in US dollar terms in the month of January, and 3.3% lower in Australian dollar terms.
Equity markets in Europe were also substantially weaker. The German DAX (8.8%), Italy (-12.9%), Spain (-7.6%) and France (-4.7%) all fell. The UK FTSE 100 was down 2.5%.
In Asia, the Japanese Nikkei 225 fell 8.0% despite gains on the last day of the month after easing measures by Bank of Japan, while Singapore (-8.8%), Taiwan (-2.3%) and Hong Kong (-10.2%) were mixed.
EQUITY MARKETS SUBSTANTIALLY LOWER IN JANUARY

Source: Bloomberg as at 31 January 2016. Past performance is not an indication of future performance.
data showed 1,000 jobs were lost in December, above the -10,000 the market expected after a revised gain of 74,900 jobs in November. This takes the Q4 total to 128,900 and the total for 2015 to 295,300, the highest since 2007.
The unemployment rate remained at 5.8% in November, well below its most recent peak of 6.4% in January 2015.
The largest gains in inflation were in Alcohol and Tobacco (+2.7% per quarter) primarily driven by an increase in the federal excise tax on tobacco and the Clothing and Footwear group (+1.6% per quarter), due to gains in accessories prices (+4.5% per quarter). Offsetting the gains were price falls telecommunication equipment and services (-2.4% per quarter) and the Transportation group (-1.4% per quarter) due to a 5.7% per quarter fall in fuel prices.
Perhaps more importantly, both measures of underlying inflation showed a slight acceleration in the pace of price rises with underlying inflation increasing by 0.55% per quarter, which was the average of the trimmed mean and weighted median measures. This took the annual pace of underlying inflation to 2.0%, down from 2.1%.
US
The US Federal Open Market Committee (FOMC) met on 26 to 27 January 2016 and decided to leave the official Fed Funds target rate at 0.25% to 0.50% as was widely expected.
The statement highlighted that “labour market conditions improved further even as economic growth slowed late last year” and presented a moderate but mixed view of the economy “household spending and business fixed investment have been increasing at moderate
The BoJ, led by Governor Kuroda, was likely prompted into action in response to the weaker inflation data, with headline inflation of just 0.2% per year recorded for December, well below its 2% inflation target. Recent Yen strength would also have been a concern for the BoJ, (signalling their unwillingness to tolerate JPY/USD below 120), as well as also wanting to break recent deflationary trends ahead of the upcoming wage negotiations.
Australian dollar
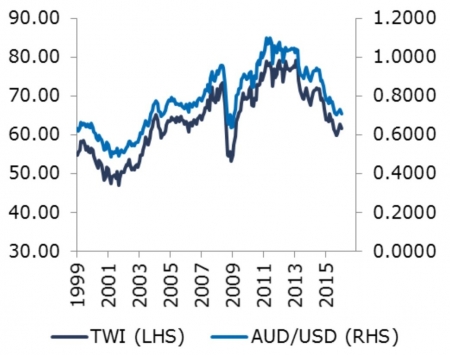
The Australian dollar was mostly weaker against the major cross currencies in January. The AUD finished down 2.8% against the USD to $US0.7084. These losses occurred despite reduced expectations of the US Federal Reserve continuing to raise interest rates in 2016.
The Australian dollar fell against the euro (-2.5%) and yen (-2.1%) and rose against sterling (+0.5%) and NZ dollar (+2.5) over the month of January.

Source: Bloomberg as at 31 January 2016
Commodities
Commodity prices were weaker in January driven by renewed signs of weakness in China and continued global oversupply.
The price of West Texas Intermediate Crude finished the month at $US33.6/bbl, down 9.2%, while the price of Brent was down 6.6% to $US36.0/bbl.
Gas prices continue to follow lower oil prices with the US Henry Hub spot price down 2.6% to will recognise a post-tax impairment charge of ~$7 billion against its onshore US energy assets. Oil and gas prices have been significantly weaker than BHP expected and have affected the company’s assessment of asset value.
Woolworths (-0.9%) announced it intends to exit the home improvement market via a sale or shutdown of its loss-making Masters business. Health care company Resmed (+8.2%) announced interim results that highlighted ongoing market share gains.
Most other ASX-listed companies will announce their results for the six or 12 months ending 31 December during February.
Listed property
The defensive nature of property securities again enabled the sector to outperform. Despite a >5% decline in the broader Australian share market, the S&P/ASX 200 Property Accumulation Index added 1.1% as investors focused on the relative stability of stocks in the sector.
Companies in the Retail sub-sector continued to perform relatively well. This area of the market has been supported recently by Australian dollar weakness. Currency movements have reduced the appeal of online shopping from overseas and underpinned sales growth from retail stores in Australia. The lower dollar is also seeing an increase in tourist numbers to Australia, further supporting the domestic retail sector. Stocks including Scentre Group (+3.8%) and Vicinity Centres (+3.9%) have benefited from these themes.
Global property securities struggled in January, with the FTSE EPRA/NAREIT Global Developed Index declining 4.3% in US Dollar terms. The Hong Kong (-12.5%) market performed particularly poorly, although the UK (-9.3%) also remained weak following disappointing performance in December. In fact Australia generated the best return among major global property regions.
Global developed market equities
Global financial markets had a volatile start to 2016, with most equity markets recording sharp losses in January. Falls were prompted at the start of this year with weaker manufacturing data in China and the US and political tensions between Saudi Arabia and Iran. These initial
Global emerging markets
Emerging market equities were weaker in January, with the MSCI Emerging Market Index down 6.5% in US dollars and 3.8% in AUD terms. Concerns around weaker Chinese growth and the continued fall in commodity prices contributed to these losses with all regions recording falls, led by MSCI Asia Ex Japan, down 7.7%. The Shanghai Composite Index fell 22.6% over January. MSCI EM Latin America fell 4.7% while MSCI EM Europe, Middle East and Africa was down 4.2% in US dollar terms.
Over the month, global credit spreads traded notably wider however this was more due to the fall in government yields than changes in credit yields. Overall, the Barclays Global Aggregate Corporate Index average spread were 24 bps wider in the month, closing at 1.83%. The Barclays US Aggregate Corporate Index average spread finished the month at 1.81%, widening by 26 bps and the Barclays European Aggregate Corporate Index widened by 16 bps to 1.50%.
Volatility continued in the US high yield credit market with weakness from the Energy and Materials sector resulting in a widening of spreads in the month. The Bank of America Merrill Lynch Global High Yield index (BB-B) spread moved 66 bps wider at 6.19%. In Asia, credit markets followed the global widening trend with the JPMorgan Asia Credit Index (JACI Composite) average spread out by 27 bps to 3.31%.
Australian credit spreads widened in the month. However, activity remained cautious as numerous factors kept investors on the fence including the holiday season, concerns over China’s growth outlook amid heightened market volatility, and dollar depreciation. The average spread of the Bloomberg AusBond Credit Index relative to swap increased marginally from 115 bps to 118 bps.
By Belinda Allen, Senior Analyst, Economic and Market Research
© Colonial First State Investments Limited ABN 98 002 348 352 AFS Licence 232468.
This document has been prepared by Colonial First State Investments Limited ABN 98 002 348 352, AFS Licence 232468 (Colonial First State) based on its understanding of current regulatory requirements and laws as at 7 September 2015. This document is not advice and provides information only. It does not take into account your individual objectives, financial situation or needs. You should read the relevant Product Disclosure Statement available from the product issuer carefully and assess whether the information is appropriate for you and consider talking to a financial adviser before making an investment decision.